Inclusive Design: Including Graph Divisions in Sonification
I held a basic assumption that sonifications should only be comprised of “non-speech sound” (Sterne and Akiyama 2012), based upon a few definitions of and experiences listening to sonification. So, I made every effort to avoid the use of speech in sonification. While working on the initial grant with PI Amy Bower, however, I questioned this idea. In early beta sonification design (Sound A below), Amy could hear sounds of the net flux of gasses between the ocean and atmosphere with sounds in the left and right ear, but couldn’t tell when these events were occurring.
Amy is a blind oceanographer who lost her sight during her career. As a science expert, Amy has a wealth of oceanographic knowledge as well as experience reading graphs. With all of Amy's experience, she could not follow certain aspects of data happening in the sonification. So if a blind oceanographer couldn’t follow the data sonification, the same expert who explained how CO2 flux works to me, how would a middle school student with no science background follow the data sonification?
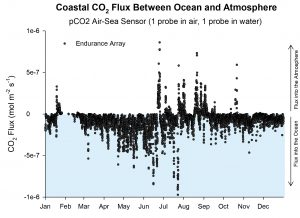
Amy also described how one aspect of net flux gas is the seasonal, or temperature impact (cold sinks in winter vs. outgassing in summer), so knowing when an event occurs is important. Amy's insights led me to focus on the graphic indications of time. The graph's divisions are indicated as calendar months. With these elements in mind, I decided to embed tick marks of months within the sonification—not as non-verbal click sounds—as months spoken by a reader (Sound B below). While I was hesitant about excluding non-English speakers by including graph divisions spoken in English, Amy's experience highlighted that a design change was critical. After including the spoken graph divisions (Sound C below), Amy provided feedback that the spoken graph divisions in the sonification allowed her to hear when events were happening, thus underscoring the seasonal cycle of the net flux phenomenon. Designing with Amy’s input and insight helped me break through my own preconceptions of what sonification is and how it can include other aspects of the graph inside an aural container. All sounds are located below.
Media
Sound A: Carbon net flux sonification without spoken graph divisions.
Sound B: The spoken graph divisions of calendar months.
Sound C: Carbon net flux sonification with spoken graph divisions of calendar months integrated.
References
Sterne, Jonathan and Mitchell Akiyama. “The Recording That Never Wanted To Be And Other Stories of Sonification.” In Oxford Handbook of Sound Studies. Ed. Trevor Pinch and Karin Bijsterveld. Oxford University Press, New York. 2012: 544-560.
Learn More
Learn more about CO2 net flux between ocean and atmosphere by visiting the NSF-funded Ocean Data Labs, Data Nuggets https://datalab.marine.rutgers.edu/data-nuggets/co2-flux/
by Jon Bellona