Sonification Click Track for Media Synchronization (Part Two)
This post is the second of two posts that outline the design of sonification click tracks for synchronization of additional media in sonification design. Sonification click tracks provide accurate yet flexible sound design, especially for related media events like axis markers, spearcons, and event-based earcons. Feel free to continue reading about an example sonification mix with click tracks, or jump back to the first post to learn about how and why they were made.
This post unpacks a sonification mix that employs sonification click tracks. The data nugget used in this sonification example is the 2015 Axial Seamount Eruption (Smith and Garzio, 2020).
I created all data sonifications and click tracks inside Kyma. The data for this particular sonification contains fourteen days (April 17 through April 30, 2015) of bottom pressure changes with data sampled every minute. Changes in bottom pressure depict the daily tidal cycle and capture the seafloor deflation of the April 24, 2015 volcanic eruption of the Axial Caldera on the Juan de Fuca plate in the NE Pacific Ocean.
I generated a twenty-second long data sonification of the fourteen days' worth of bottom pressure data using parameter-mapping sonification techniques. The sound is a harmonic noise generator played through a stereo 4-pole lowpass filter, which is a Moog ladder filter with a self-oscillating resonance model. The range of the data controls the filter’s cutoff from 250Hz to 4k (a four-octave range). Before the seafloor deflation, most of the data moves within the upper two octaves of filtered noise, and after the eruption, most of the data moves between the lower two octaves of filtered noise. The sound design of the tidal cycle sonification was developed based on feedback from our Sonic Foundations Survey.
Audio. Twenty second sonification of fourteen days' worth of bottom pressure changes that sound the daily tidal cycle and capture the seafloor deflation of the 2015 volcanic eruption. The audio is the sonification only.
I knew I wanted to mark the volcanic eruption in the sonification with an earcon, but I also wanted to try out marking the week around the April 24th event (April 20th and 27th) with spearcons. I recorded a sonification click track with three clicks using Time Index threshold clicks in Kyma.
The following figure shows two audio tracks in Logic implementing this feature. The top track is the sonification click track with three event-based clicks across twenty seconds. The bottom track has the short eruption sound that was aligned using the middle click. Both the tidal cycle sonification and the eruption earcon sound were crafted using our Sonic Foundations Survey.
Audio. Twenty-second sonification of fourteen days' worth of bottom pressure changes and includes a volcanic eruption earcon synchronized with a sonification click track.

Figure. Two audio tracks in Logic: the top track is a sonification click track with three event-based clicks across twenty seconds; the bottom track has a single audio region aligned to the middle click from the top track.
Although I created sync clicks for spearcons, after reviewing, I wanted more regularly marked days throughout the entire sonification. So I generated another sonification click track, shown in the following image. This click track contained fourteen equally-spaced clicks across its twenty seconds. Each click represents the start of each day’s data, from April 17th through April 30th, 2015.

Figure. Two audio tracks in Logic: the top track is a sonification click track with fourteen equally-spaced clicks across twenty seconds; the bottom track contains several audio regions aligned to the clicks in the top track.
Essentially, the sonification click track demarcates the x-axis of a time-series graph. The click track could be played as clicks to indicate daily tick marks or used to simply sync spearcons with the sonification. I recorded both versions and included these sonification mixes below. The eruption earcon is in both sonification mixes.

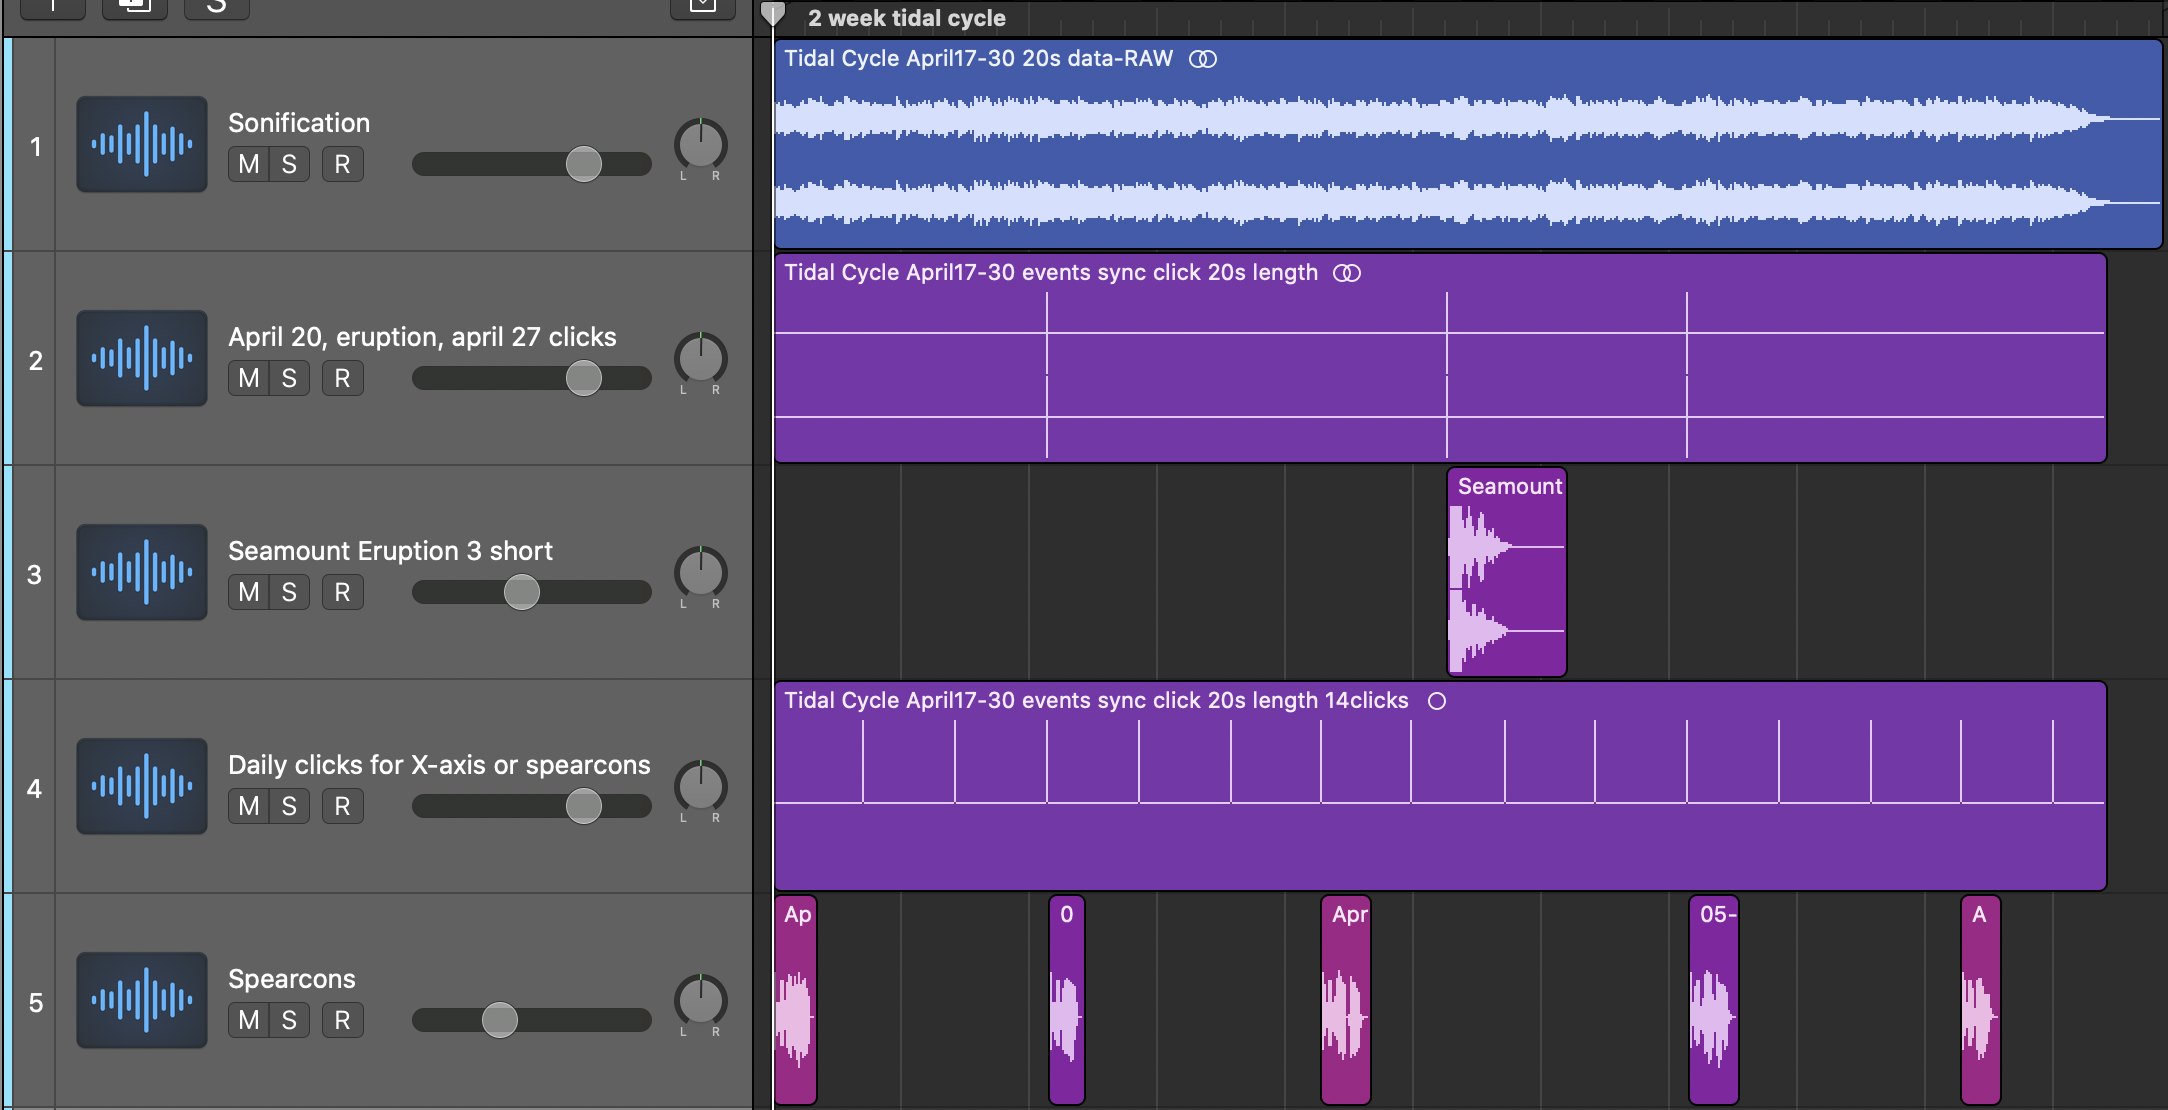
Figure. Five tracks of a sonification mix in Logic Pro X — the sonification track, the event-based click track, the eruption earcon track, the daily indicator click track, and the synchronized spearcon track.
The image above shows all five tracks of the sonification mix — the sonification track, the event-based click track, the eruption earcon track, the daily indicator click track, and the synchronized spearcon track — inside Logic Pro X. The layering of tracks provides flexibility in the sound design process. Any track can be turned on/off, adjusted in gain, or processed independently of all other tracks. The multi-track approach allows for more feedback and iteration than in previous sonification work.
References
Smith, Leslie M., Lori Garzio. "2015 Axial Seamount Eruption" Data Nuggets. Ocean Data Labs. 2020. https://datalab.marine.rutgers.edu/data-nuggets/axial-eruption/
Learn More
Learn more about data sonification.
Learn more about sound design.
Learn more about Kyma.
Learn more about our Sonic Foundations Survey.
Learn more about sonification click tracks.
by Jon Bellona