Audio Display Prototype: 2015 Axial Seamount Eruption
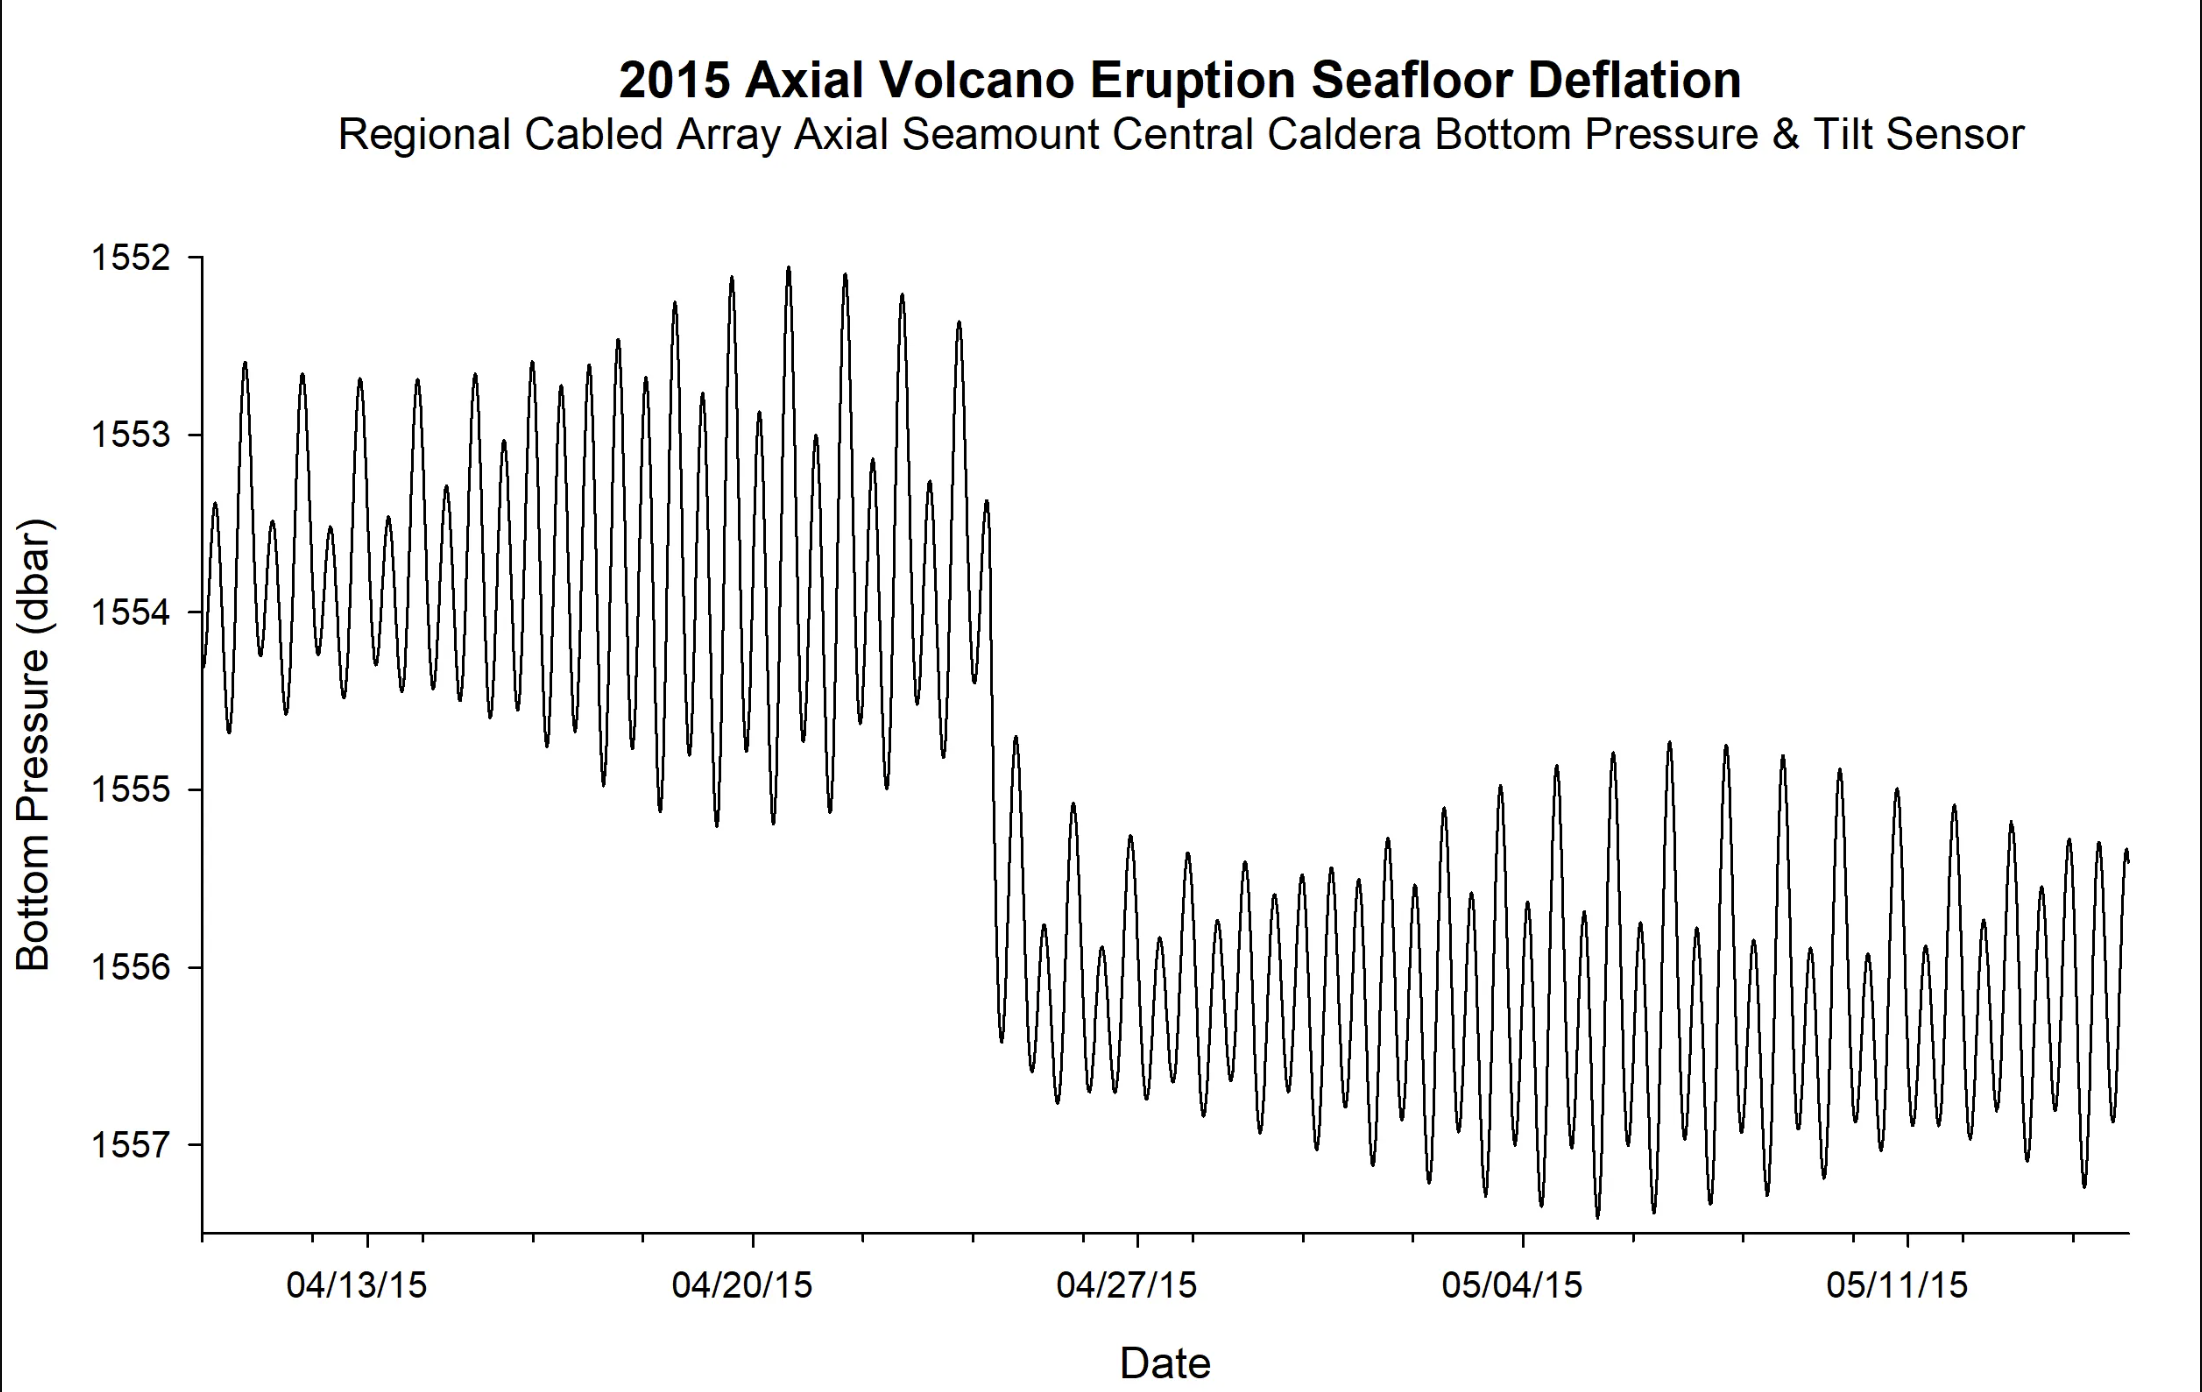
Based on data sonifications I made for the 2015 Axial Seamount Eruption Data Nugget, I mocked up an audio display prototype, which I have included below. The audio display has three tracks that roughly span four minutes in length. I included the graph of the 35 days of bottom pressure sensor data alongside a playlist of the audio files. The audio display material consists of a narrator, five sonifications, and a few earcons embedded within the sonification mix. To additionally mock up the sound of natural environment bed tracks, I have six audio files in the playlist. Tracks 1 - 3 contain the sound of waves as a bed track under the narrator. Tracks 4 - 6 are the same audio display but without an environmental bed track under the narrator.
Headphones are best for listening.

References
Smith, Leslie M., Lori Garzio. "2015 Axial Seamount Eruption." Data Nuggets. Ocean Data Labs. 2020. https://datalab.marine.rutgers.edu/data-nuggets/axial-eruption/
Siu, Alexa, Gene S-H Kim, Sile O’Modhrain, and Sean Follmer. “Supporting Accessible Data Visualization Through Audio Data Narratives.” In CHI Conference on Human Factors in Computing Systems, 1–19. New Orleans LA USA: ACM, 2022. https://doi.org/10.1145/3491102.3517678.
Learn More
Learn more about data sonification.
Learn more about sound design.
Learn more about the parameters of sound.
by Jon Bellona