Audio Display Prototype: Axial Long Term Seafloor Record
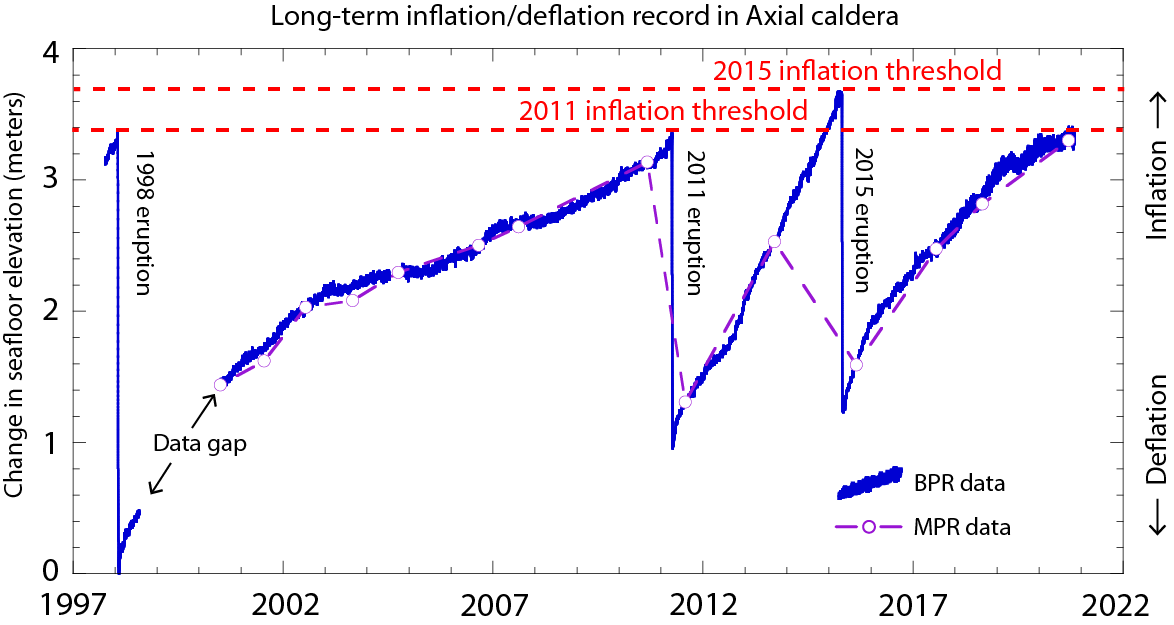
Based on core lessons from the 2015 Axial Seamount Eruption Data Nugget, I created data sonifications and mocked up an audio display prototype, which I have included below. Please note that the Ocean Labs data nugget does not include the graph (included below) that we sonified and developed an audio display for; yet, the graph is important to demonstrate a core lesson that seafloor inflates and deflates over time as a result of volcanic activity. The graph we sonified and created an audio display for comes from the Axial Seamount blog from the Earth-Oceans Interactions Program site.
The audio display has five tracks that span just over six minutes in length. I included the graph of the time-series plot of bottom pressure data of the long term record of seafloor from 1997 through 2021 in the Axial Caldera in the NE Pacific Ocean. This is alongside a playlist of the audio files. The audio display material consists of a narrator, six sonifications, and a few earcons embedded within the sonification mix. To additionally mock up the sound of natural environment bed tracks, I mixed an underwater ambience track beneath the narrator.
Headphones are best for listening.

References
Smith, Leslie M., Lori Garzio. "2015 Axial Seamount Eruption." Data Nuggets. Ocean Data Labs. 2020. https://datalab.marine.rutgers.edu/data-nuggets/axial-eruption/
Chadwick, B., and S. Nooner. "Blog to chronicle eruption forecasts at Axial Seamount." PMEL Earth-Ocean Interactions Lab. NOAA. https://www.pmel.noaa.gov/eoi/axial_blog.html
Learn More
Learn more about data sonification.
Learn more about sound design.
Learn more about the parameters of sound.
by Jon Bellona