Audio Display Prototype: Daily Vertical Migration Gets Eclipsed
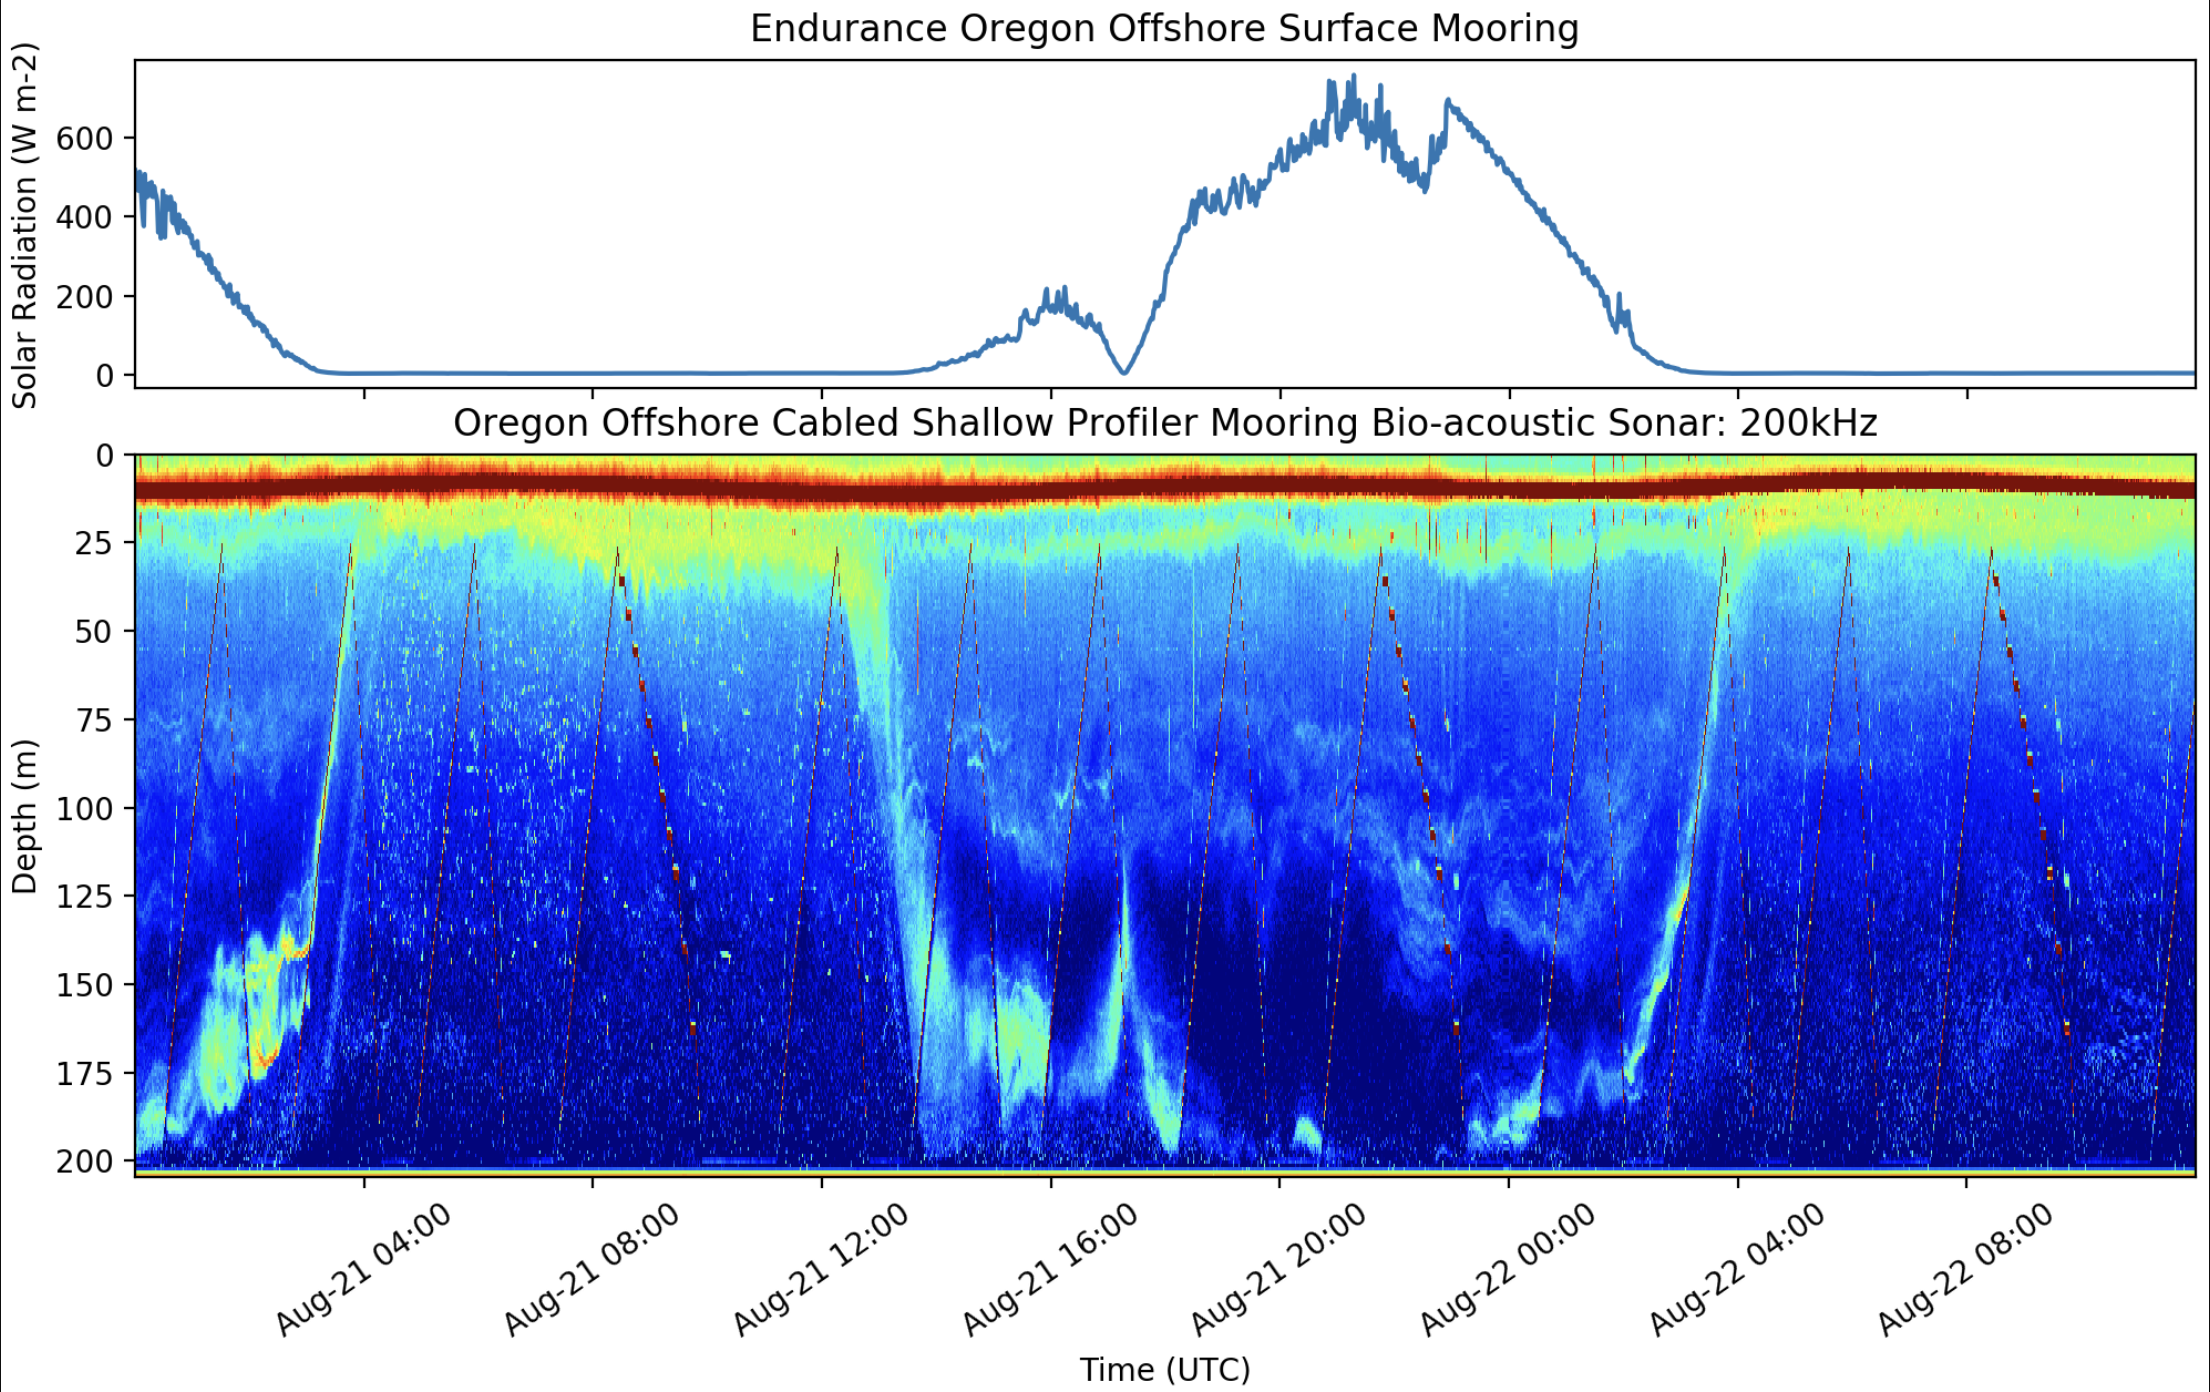
Based upon data sonifications I made for the Daily Vertical Migration Gets Eclipsed! Data Nugget, I mocked up an audio display prototype. I still need to get team member reviews and feedback before creating a final version we can integrate into the evaluation phase of the pilot project. Thinking of the audio display as an end product was helpful for me in working with creating data sonifications overall.
The Zooplankton Daily Vertical Migration audio display has five tracks that roughly span five-and-a-half minutes. I included the graph of the data alongside a playlist of the five audio files. The material consists of a narrated script and eight sonifications embedded within the narration. I chose not to include natural environment sounds as bed tracks.
Headphones are best for listening.

References
Smith, Leslie M., Lori Garzio. "Daily Vertical Migration Gets Eclipsed!" Data Nuggets. Ocean Data Labs. 2020. https://datalab.marine.rutgers.edu/data-nuggets/zooplankton-eclipse/
Siu, Alexa, Gene S-H Kim, Sile O’Modhrain, and Sean Follmer. “Supporting Accessible Data Visualization Through Audio Data Narratives.” In CHI Conference on Human Factors in Computing Systems, 1–19. New Orleans LA USA: ACM, 2022. https://doi.org/10.1145/3491102.3517678.
Learn More
Learn more about data sonification.
Learn more about sound design.
Learn more about the parameters of sound.
by Jon Bellona