Auditory Display: Axial Long Term Seafloor Inflation Record, short version
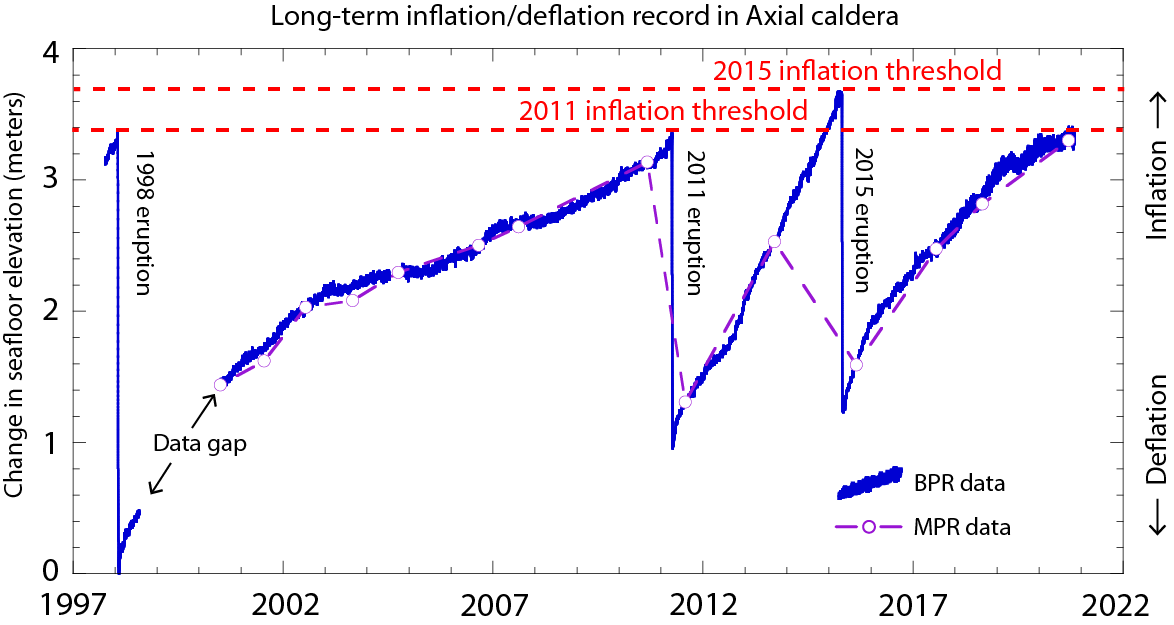
Based on cognitive load in informal learning environments, we knew we needed to reduce the length of our auditory displays. We started this process with the Long term Seafloor Inflation Record. We reduced the script and tightened up the auditory key, or legend, for the data sonification. The audio media player is below. For more about the version update and graph, please see our previous post on the Axial Seafloor Inflation Record auditory display.
Please note that the graph we sonified and created an auditory display for comes from the Axial Seamount blog from the Earth-Oceans Interactions Program site. The graph is a time-series plot of bottom pressure data of the long-term record of the seafloor from 1997 through 2021 in the Axial Caldera in the NE Pacific Ocean. The audio in the initial hook track is audio of the axial seamount eruption that University of Washington oceanographer John Delaney recorded. For more about the audio of the seamount eruption, check out the KUOW story.
Feel free to reach out and let us know what you think!
Headphones are best for listening.

References
Smith, Leslie M., Lori Garzio. "2015 Axial Seamount Eruption." Data Nuggets. Ocean Data Labs. 2020. https://datalab.marine.rutgers.edu/data-nuggets/axial-eruption/
Chadwick, B., and S. Nooner. "Blog to chronicle eruption forecasts at Axial Seamount." PMEL Earth-Ocean Interactions Lab. NOAA. https://www.pmel.noaa.gov/eoi/axial_blog.html
Learn More
Learn more about data sonification.
Learn more about sound design.
Learn more about the parameters of sound.
by Jon Bellona