Auditory Display: Daily Vertical Migration Gets Eclipsed, v2
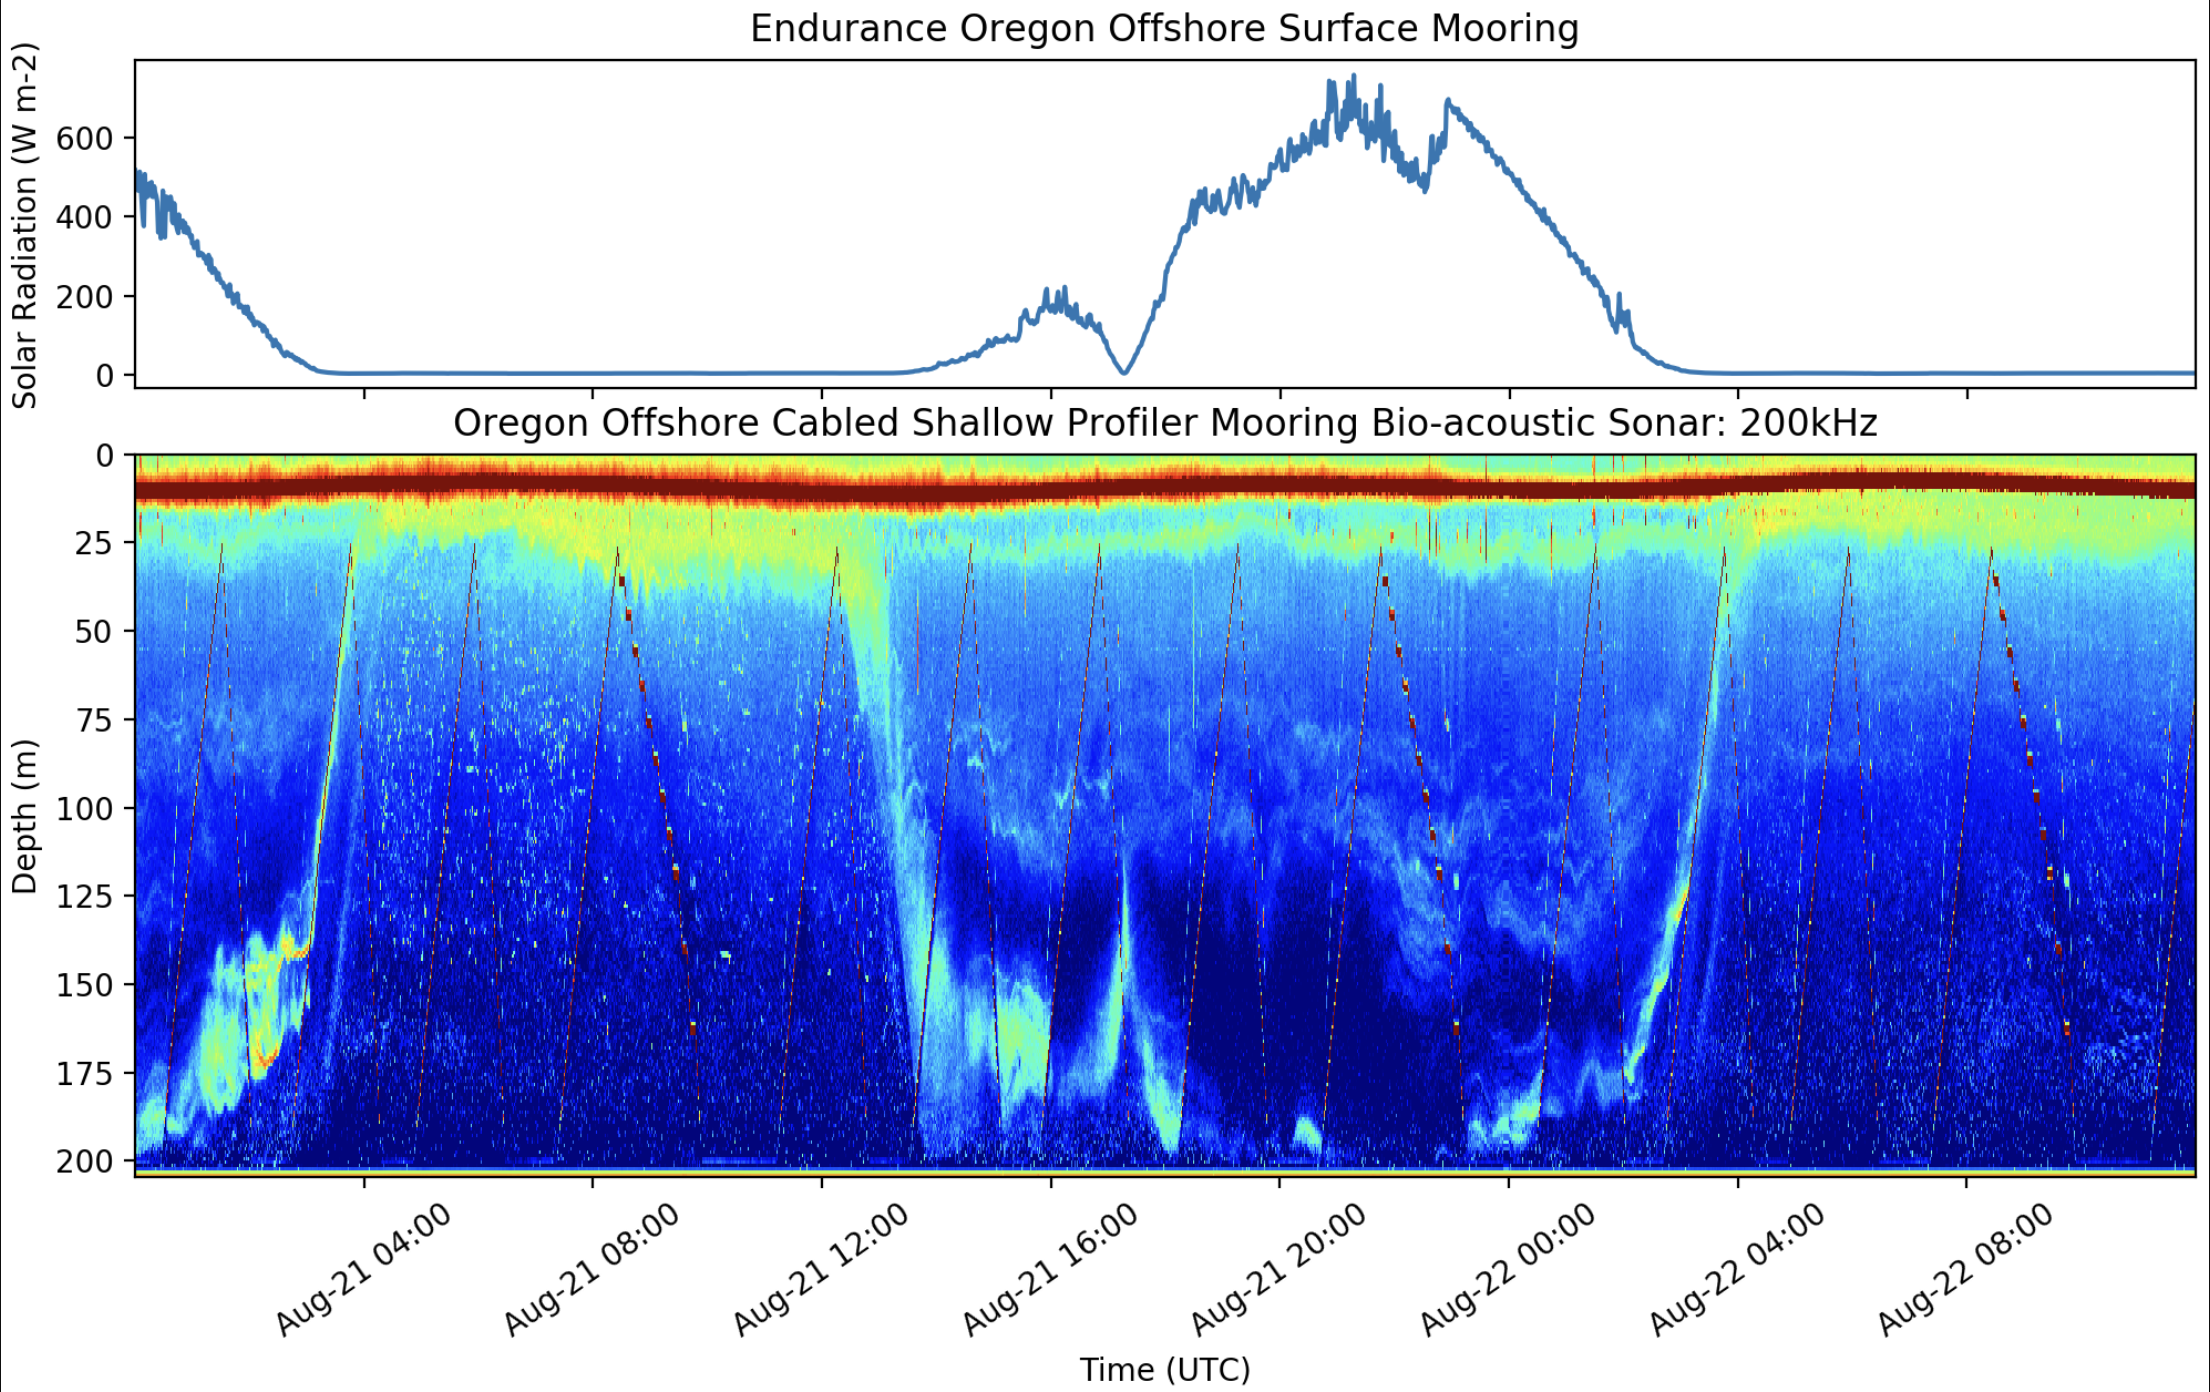
Based on input from our team, research with blind and low-vision (BLV) students in schools, and insights learned over the past year, we have updated our auditory display for the Daily Vertical Migration Gets Eclipsed! Data Nugget. I re-recorded narration audio, and mixed underlying music, sound effects, and data sonification snippets as part of the auditory display. We also added an initial hook track and an introduction. The audio media player is below. Please note that we removed track 1B in order to reduce redundancy in the display. A graph of the data is also displayed below.
Headphones are best for listening. Feel free to reach out and let us know what you think.
If you're interested in using this auditory display or citing it in your research, please visit https://doi.org/10.5281/zenodo.8173914

References
Smith, Leslie M., Lori Garzio. "Daily Vertical Migration Gets Eclipsed!" Data Nuggets. Ocean Data Labs. 2020. https://datalab.marine.rutgers.edu/data-nuggets/zooplankton-eclipse/
Siu, Alexa, Gene S-H Kim, Sile O’Modhrain, and Sean Follmer. “Supporting Accessible Data Visualization Through Audio Data Narratives.” In CHI Conference on Human Factors in Computing Systems, 1–19. New Orleans LA USA: ACM, 2022. https://doi.org/10.1145/3491102.3517678.
Learn More
Learn more about data sonification.
Learn more about sound design.
Learn more about the parameters of sound.
by Jon Bellona