Data sonification sync with data graph animation
From creating data sonifications in Kyma, one sonification that I was excited to synchronize audio with the data plot was the Zooplankton daily vertical migration and solar radiation during the August 21, 2017 total solar eclipse. This post outlines the data and solar eclipse phenomenon, various sonifications, and the video sync process.
The chart and data come from NSF-funded Ocean Data Lab’s Data Nuggets (Smith and Garzio 2020). The downloadable .csv data for this Data Nugget depicts solar radiation over the span of 36 hours and covers the August 21, 2017 eclipse. There is also a NetCDF file from a bio-acoustic sonar that shows zooplankton daily vertical migration patterns. Since zooplankton travel to the surface to eat when the water column darkens, it’s fascinating to have a zooplankton journey captured during a total solar eclipse. Spoiler alert, the zooplankton get punk’ed by the eclipse.
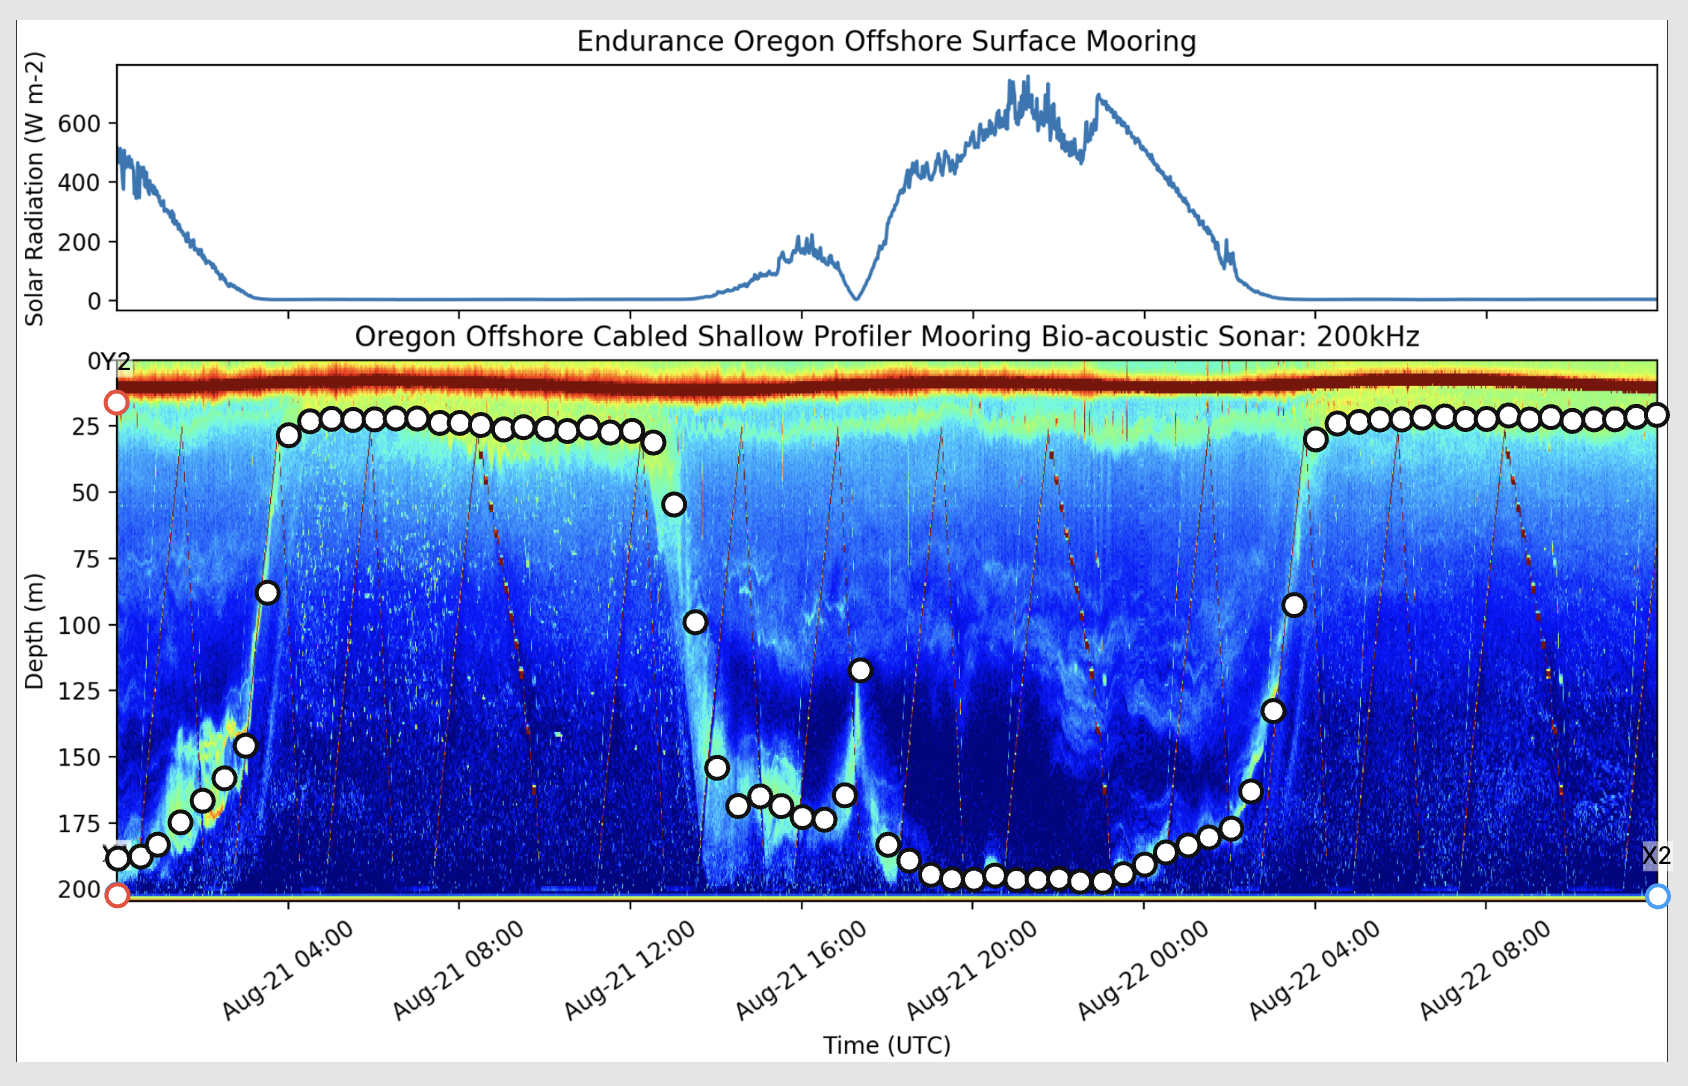
Since the NetCDF bio-acoustic sonar data generates an image, I used Plot Digitizer to generate a .csv data plot with a 30-minute sampling rate for sonifying the zooplankton’s depth in Kyma. Figure 1 shows the sampling plot inside Plot Digitizer, and I included the .csv data file below under Media.

Figure 1. Graph that depicts the changes in the daily vertical migration cycle of zooplankton and the solar radiation around the 2017 Total Solar Eclipse. 30-minute sampling using Plot Digitizer for zooplankton depth captured by sonar in NetCDF format.
Based upon feedback from our Sonic Foundations survey for solar radiation and zooplankton movement, I updated sound designs of daily solar and migration patterns using data models for a 24-hour period. These initial sonifications are not included here, but their design and additional feedback from the project team led me to generate two twenty-second data sonifications of the August 21 solar eclipse event. These two data sonifications are shown below as YouTube videos.
The first 20-second data sonification includes linear playback of the data across its 36-hour range (video 1).
The second 20-second data sonification includes non-linear playback of the data with a slow motion playback of data during the 2017 solar eclipse (1605 UTC to 1830 UTC). The full solar eclipse took place around 1716 UTC given the position of the Endurance array off the coast of Oregon. Because of the non-linear playback, I marked the eclipse event with two spearcons (“Eclipse start” and “Eclipse end” respectively).
The two data streams and different playback mechanisms prompted me to synchronize the two sonifications with the original data plot image by Smith and Garzio. Using Adobe Premiere Pro, I brought in the graph and indicated the time of the sonification length. I then generated vertical red lines for indicating location using the shape tool and overlaid these on the graph along the left x-axis. I used keyframes to match the exact points in the data sonification with the location in the graph along the x-axis. The non-linear playback included two additional keyframes to match the slow-motion data playback. I uploaded both data sonification animation videos onto YouTube to make viewing easy and included these videos below.
Media
Plot Digitizer .csv data file, depicting depths of the zooplankton in 30m increments across the 36-hour period.
Video 1. Zooplankton daily vertical migration and solar radiation sonification with linear playback. In case the video does not load, YouTube link to access.
Video 2. Zooplankton daily vertical migration and solar radiation sonification with non-linear playback and eclipse event indicated by spearcons. In case video does not load, YouTube link to access video.
References
Smith, L.M. and L. Garzio. 2020. “Daily Vertical Migration Gets Eclipsed!” Ocean Data Labs. Rutgers University. https://datalab.marine.rutgers.edu/data-nuggets/zooplankton-eclipse/
This article was created with the support of NSF-funded grant #2115751.
Bower, A., J. Bellona, J. Roberts, and L.M. Smith. 2021. Accessible Oceans: Exploring Ocean Data through Sound. National Science Foundation Grant #2115751. https://www.nsf.gov/awardsearch/showAward?AWD_ID=2115751&HistoricalAwards=false
Learn More
Learn more about data sonification.
Learn more about sound design.
Learn more about the parameters of sound.
by Jon Bellona