Audification
One of the most direct ways to sonify a data stream is that of audification, which is “a direct translation of a data waveform to the audible domain” (Kramer 1994). Turning data into a waveform consists of treating data points as amplitude values in an audio signal. The direct correlation of data-as-audio signal has advantages (Worrall 2019: 36-8) but often requires large amounts of data captured at a periodic rate (equally-spaced data points). The audification process can be described as “0th-order” mapping (Scaletti 1994).
A notable example of audification is NASA’s Mars Landing in 2018. An air pressure sensor recorded air vibrations directly on Dec. 1, 2018. These vibrations were sped up to human hearing—the resulting audification evokes the sound of wind, with wind-speed estimations between 10 to 15 mph, or roughly 5 to 7 meters a second (Coldewey 2018) (see Audio Example 1).
Another example commonly sonified using audification is seismic data, and this makes sense considering how earthquake data is collected at sub-audio rate over long periods of time and has been largely successful in seismic "categorization" (Walker and Nees 2011). Earthsound is one project that has sonified seismometers and micro barometers with an audification process (Bullitt 2021) (see Audio Example 2).
Audio Example 1. Mars Rover Landing, Air-Pressure Sensor Audification, NASA. Dec. 1, 2018.
Audio Example 2. The Earthsound Project. JT Bullitt. PHME1a, 2021.
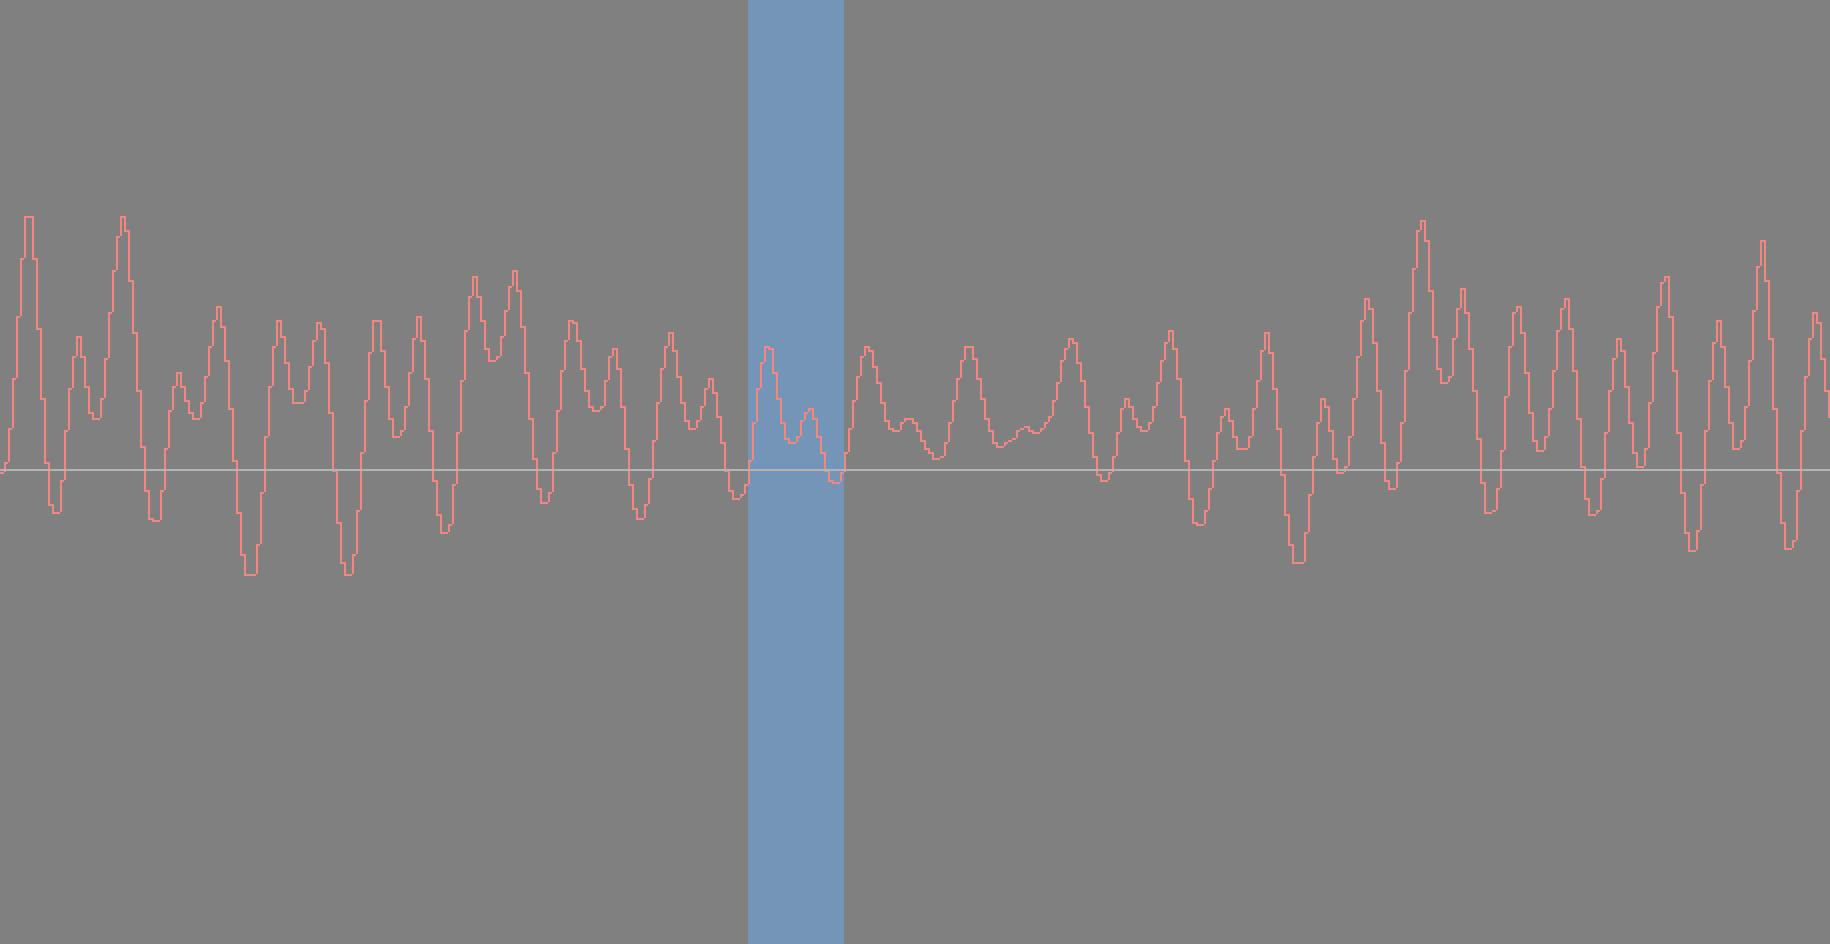
It is important to note how the digital sampling rate in playback impacts a sonification’s base frequency — our perceived pitch of the sonified phenomena. For example, if we sonify the tidal cycle with 1-hour data sampling rate using a 0th-order mapping, the daily high and low tides create a periodic, or repeating, waveform (see Figure 1). However, we will hear the tidal cycle at different frequencies depending upon the digital sampling rate. At a sampling rate of 48kHz, the daily tidal cycle, every 24 samples, will create a frequency at 2000 Hz (see Audio Example 3). Using a 44.1k sampling rate, the same phenomenon would generate a 1837.5 Hz tone (see Audio Example 4). Because these audio examples audify data collected from Venetian tides (1980-1995), the existence of daily dual high tides also results in a second higher frequency contained in the aforementioned audio examples.

Figure 1. Venetian Tide Audification Waveform
Audio Example 3. Venetian tides audification, 48k sampling rate, 2000 Hz daily tide frequency.
Audio Example 4. Venetian tides audification, 44.1k sampling rate, 1837.5 Hz daily tide frequency

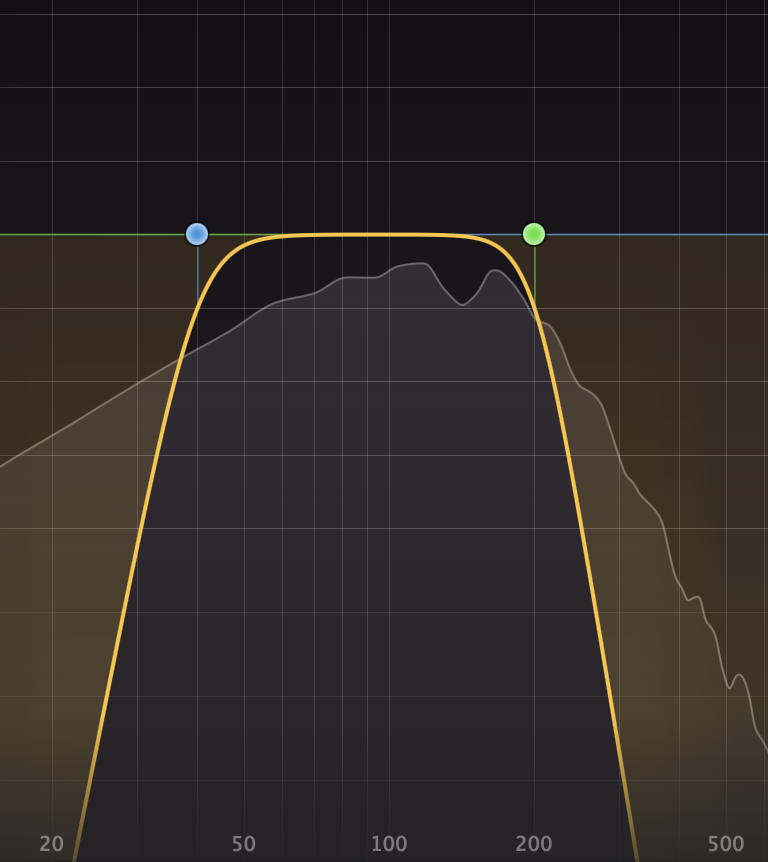
Figure 2. FabFilter Pro-Q 3 audio plugin view showing 200 Hz low-pass and 40 Hz high-pass filters applied on the Venetian tides audification signal. Listen to Audio Example 5.
Audification can be modified for comprehension. Playback rate, filtering, side-band modulation, interpolation, audio compression, and other signal-processing may be applied to the original data-as-audio signal (Worrall 2019; Scaletti 2018; Groß-Vogt, Frank, and Höldrich 2020). Using the Venetian tides audification example again, we can find another tidal cycle every 672 data samples, marking the 28-day lunar cycle. This 71.42 Hz lunar cycle frequency—based upon a 48k sampling rate—is harder to hear with the loud, mid-range frequencies of the daily tidal cycle present in the audio signal. By applying low-pass and high-pass filters to the audio signal (see Figure 2), we can isolate the frequencies in the sound to better identify the low-frequency oscillation that marks the lunar cycle (see Audio Example 5).
Audio Example 5. Venetian tides audification, 48k sampling rate, 40 Hz high-pass and 200 Hz low-pass filters applied
References
Bullitt, JT. “Earthsound Project.” The Earthsound Project, 2015–. https://www.earthsound.earth/content/about.html.
Coldewey, Devin. “Listen to the Soothing Sounds of Martian Wind Collected by NASA’s InSight Lander.” TechCrunch. December 7, 2018. https://techcrunch.com/2018/12/07/listen-to-the-soothing-sounds-of-martian-wind-collected-by-nasas-insight-lander/amp/.
Groß-Vogt, Katharina, Matthias Frank, and Robert Höldrich. “Focused Audification and the Optimization of Its Parameters.” Journal on Multimodal User Interfaces 14, no. 2 (June 2020): 187–98. https://doi.org/10.1007/s12193-019-00317-8.
Kramer, Gregory. “Some organizing principles for representing data with sound.” In: Auditory Display: Sonification, Audification, and Auditory Interfaces. ed. Gregory Kramer, 18: 185-221. Proceedings Volume 18, Santa Fe Institute Studies in the Sciences of Complexity. Reading, Mass: Addison-Wesley, 1994.
Scaletti, Carla. “Sonification ≠ Music.” In Oxford Handbook of Algorithmic Composition, edited by Roger T. Dean and Alex McLean, 1:363--385. Oxford University Press, 2018. https://doi.org/10.1093/oxfordhb/9780190226992.013.9.
Scaletti, Carla. “Sound Synthesis Algorithms for Auditory Data Representations.” In Auditory Display: Sonification, Audification and Auditory Interfaces, ed. Gregory Kramer, 18:223–52. Proceedings Volume 18, Santa Fe Institute Studies in the Sciences of Complexity. Reading, Mass: Addison-Wesley, 1994.
Walker, B. N. and Nees, M. A. (2011). Theory of sonification. In Hermann, T., Hunt, A., Neuhoff, J. G., editors, The Sonification Handbook, chapter 2, pages 9–39. Logos Publishing House, Berlin, Germany.
Worrall, David. Sonification Design: From Data to Intelligible Soundfields. Human-Computer Interaction Series. Cham: Springer, 2109.
Learn More
Learn more about data sonification.
Learn more about the parameters of sound.
Learn more about data mapping.
by Jon Bellona