Using Audio Markers as Sonification Exploration Prototype
While reading “Rich Screen Reader Experiences for Accessible Data Visualization” by Zong, et al., two items struck me related to data sonification. First, the literature review and study’s co-design experience amplified the message that screen reader users desire “an overview,” followed by user exploration as part of “information-seeking goals” (Zong et al. 2018). Even though our pilot’s aim doesn’t really provide space for the type of tool-building or evaluation of user exploration of data sonifications/visualizations that their article addresses, our co-design process is somewhat focused on a data “overview” aspect. One aim in the pilot is to “inclusively design and pilot auditory display techniques…to convey meaningful aspects of ocean science data” and I hear how our Data Nuggets data sonifications being developed from co-designing auditory display elements (data sonifications, data narratives, etc) sounds like a related focus.
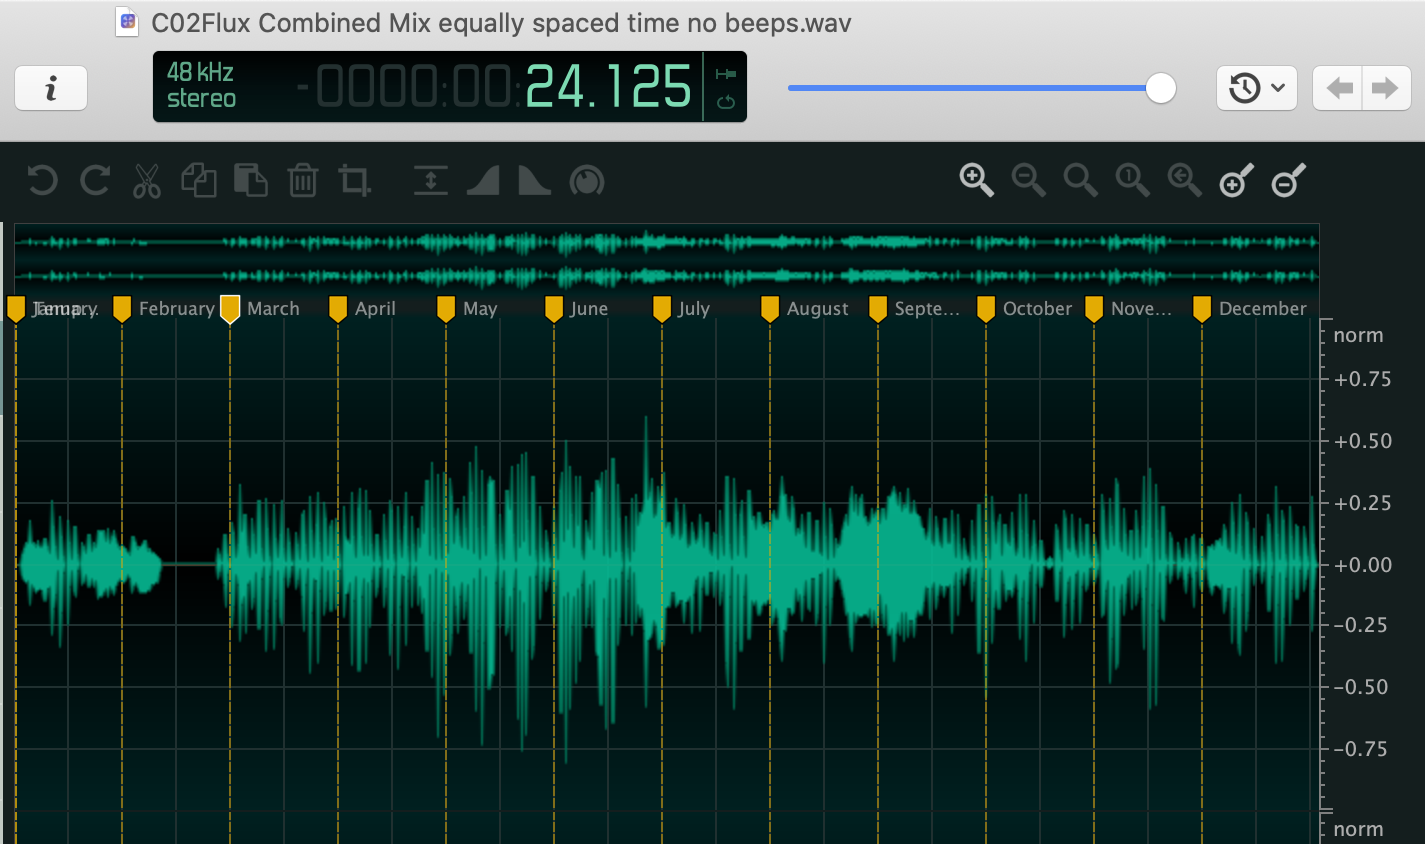
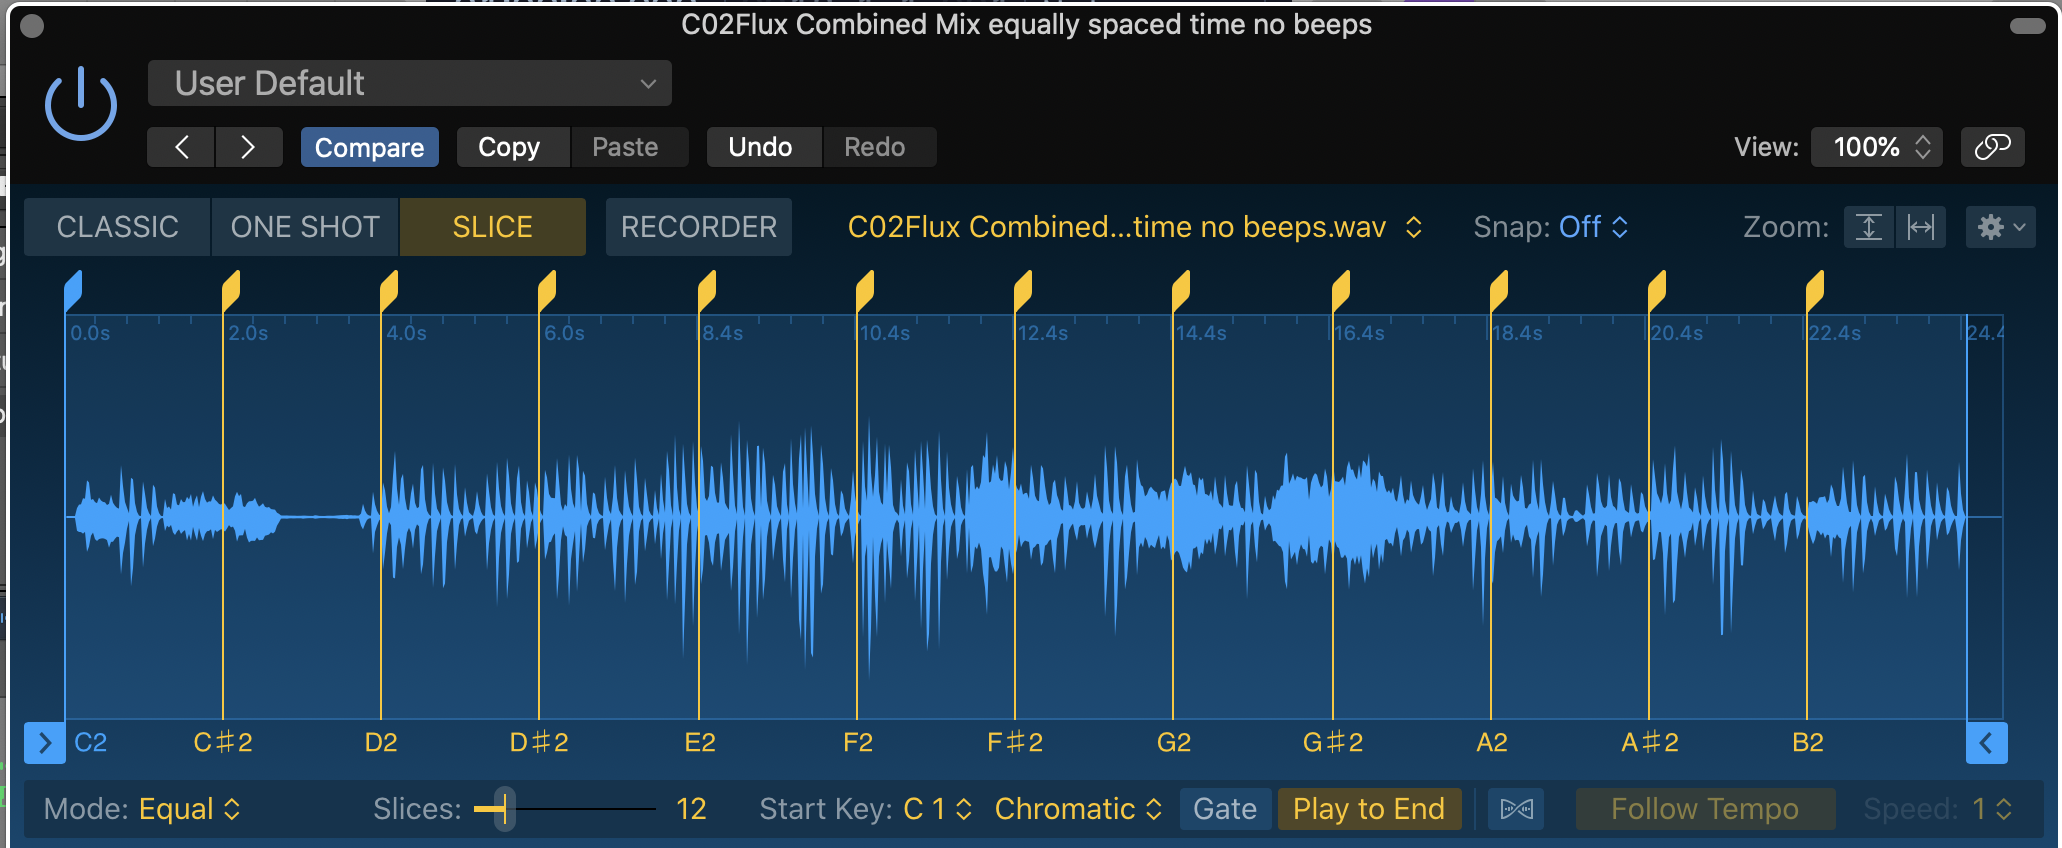
Second, what struck me was the call for screen readers to be able to “traverse accessible structure to explore data or locate specific points” (ibid: 4). In sound, my mind immediately raced toward sonification ‘callouts’ or embedded audio markers that users could move between and playback with keyboard shortcuts. Audio markers include both digital audio workstation (DAW) track markers that help identify song sections and other key elements in a timeline and embedded audio markers that often serve as loop points, sampling keys, and anchors as part of audio regions and their respective files on disk. Similar to metadata, embedded audio markers can travel with the digital audio file and can be read by many audio softwares. For example, two-track editors like Ocen Audio (Figure 1), digital audio workstation software like Logic Pro X (Figure 2), and sound design environments like Kyma all have the ability to read, add, or edit audio markers.
Even though we didn’t propose to necessarily build exploration tools as part of the pilot, I knew I could rapid prototype an idea for future discussion and tool-building. I was able to get a prototype working in about an hour, although I recognize it’s not without its accessibility flaws. I will next outline the prototyping process, the prototype, and provide some media (audio and images) examples.
Using audio samplers to playback data sonifications from specific points in time using a keyboard

Figure 1. Ocen Audio software displaying audio file that contains embedded audio markers
For this prototype, quickly creating audio markers in a data sonification audio file for user-exploration employs the concept of audio chopping. Chopping stems from popular music, where chopping an audio file is used in hip-hop for beat creation and used as part of hardware trackers found in video-game and electronic music idioms. Chopping uses audio markers — most often markers auto-generated via transients (onset times of waveforms, like drum hits) or via the grid (e.g., beat divisions based upon a tempo beats-per-minute (BPM)). The chopping process is quick, often with just a few clicks one can create audio markers.
What also makes chopping appealing is that auto-generated markers auto-map onto a USB piano keyboard for immediate and user-defined playback. This is where “user exploration” or “traversable structure” of data sonification comes into focus. Chopping is often done in a software or hardware audio sampler to generate access to real-time performative playback.

Figure 2. Logic Pro X Quick Sampler with equally-spaced playback markers
Audio samplers have been around in digital technology over the last 35+ years and used in sequencing and live-performance of audio in just about every genre. For some iconic live performance sampling, just listen to DJ Shadow, J Dilla, or Flying Lotus. And to understand the impact sampling technology has had on our cultural landscape, simply note that J Dilla’s MPC-3000 now lives in the Smithsonian Institute.
In digital audio workstation software like Logic Pro X, chopping audio is simply a matter of navigating the interface with a few clicks. I recognize that this is where my prototyping process gets into accessibility issue territory; I am documenting. Please hang on— my idea is and was about the final prototype to set up exploration and to rapidly build it, not to focus on the process of its creation.

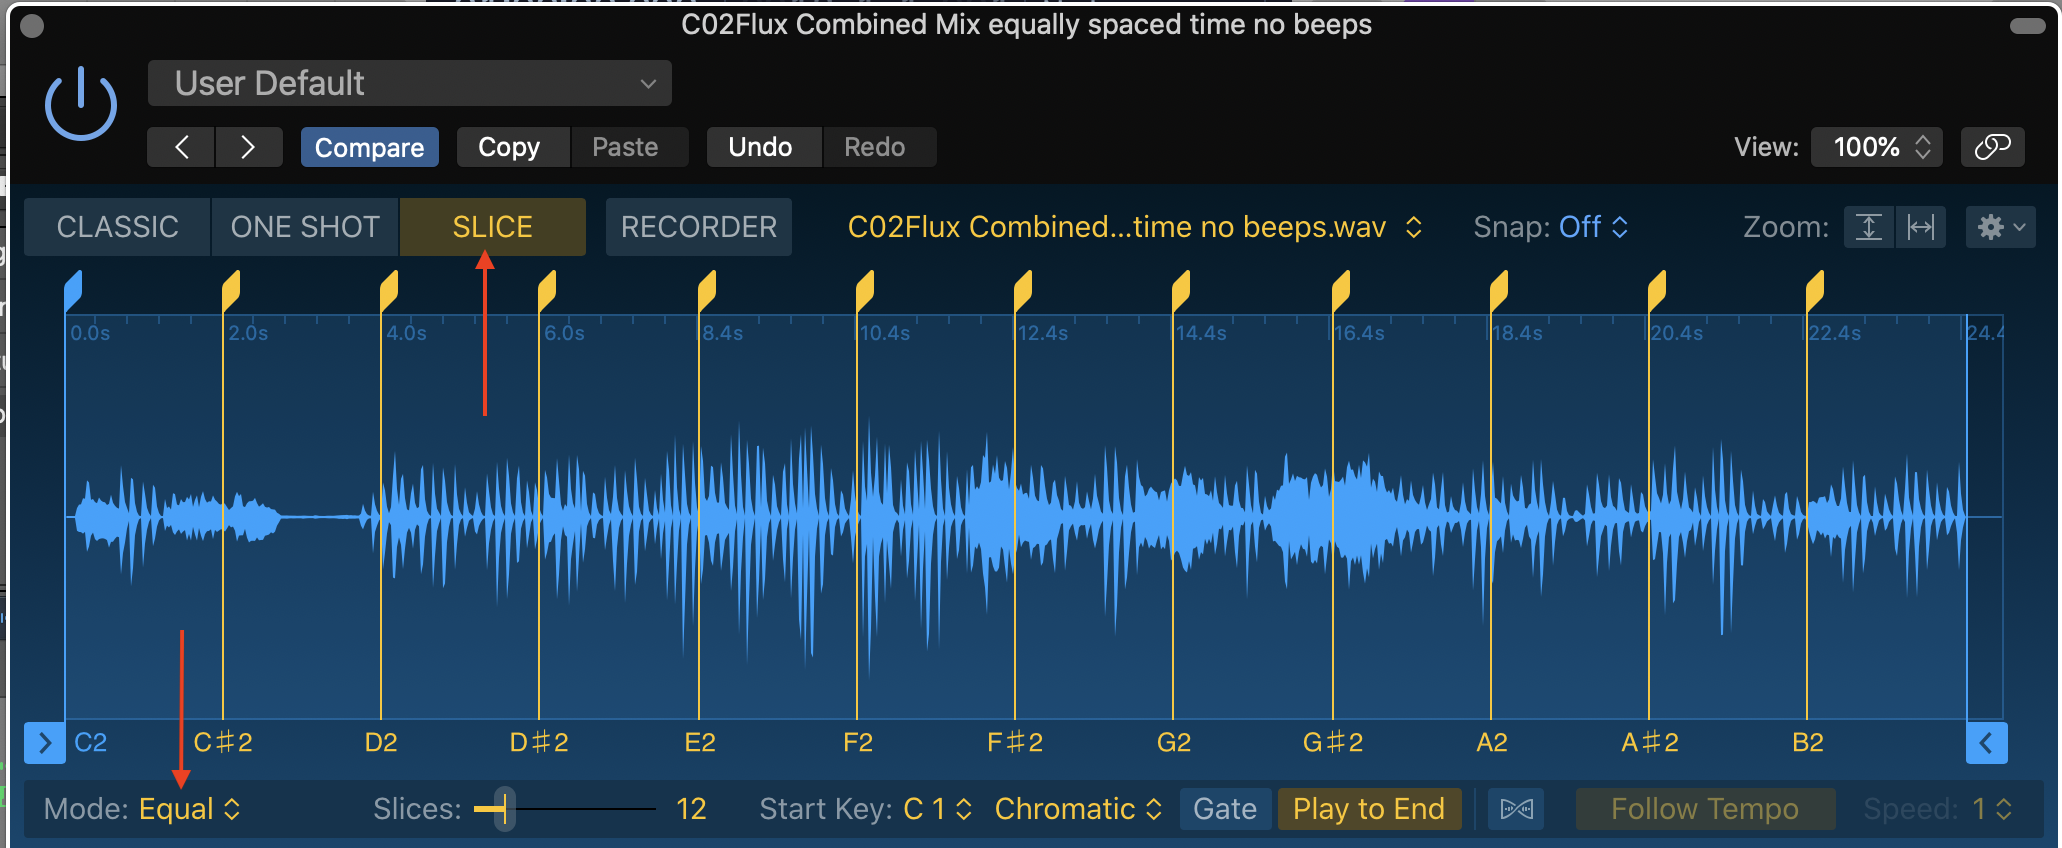
Figure 3. Logic Pro X Quick Sampler with arrows highlighting Slice Mode and Equal Division settings with twelve slices. For this sonification, each audio slice equals one month of sonified data (January through December) across one year.

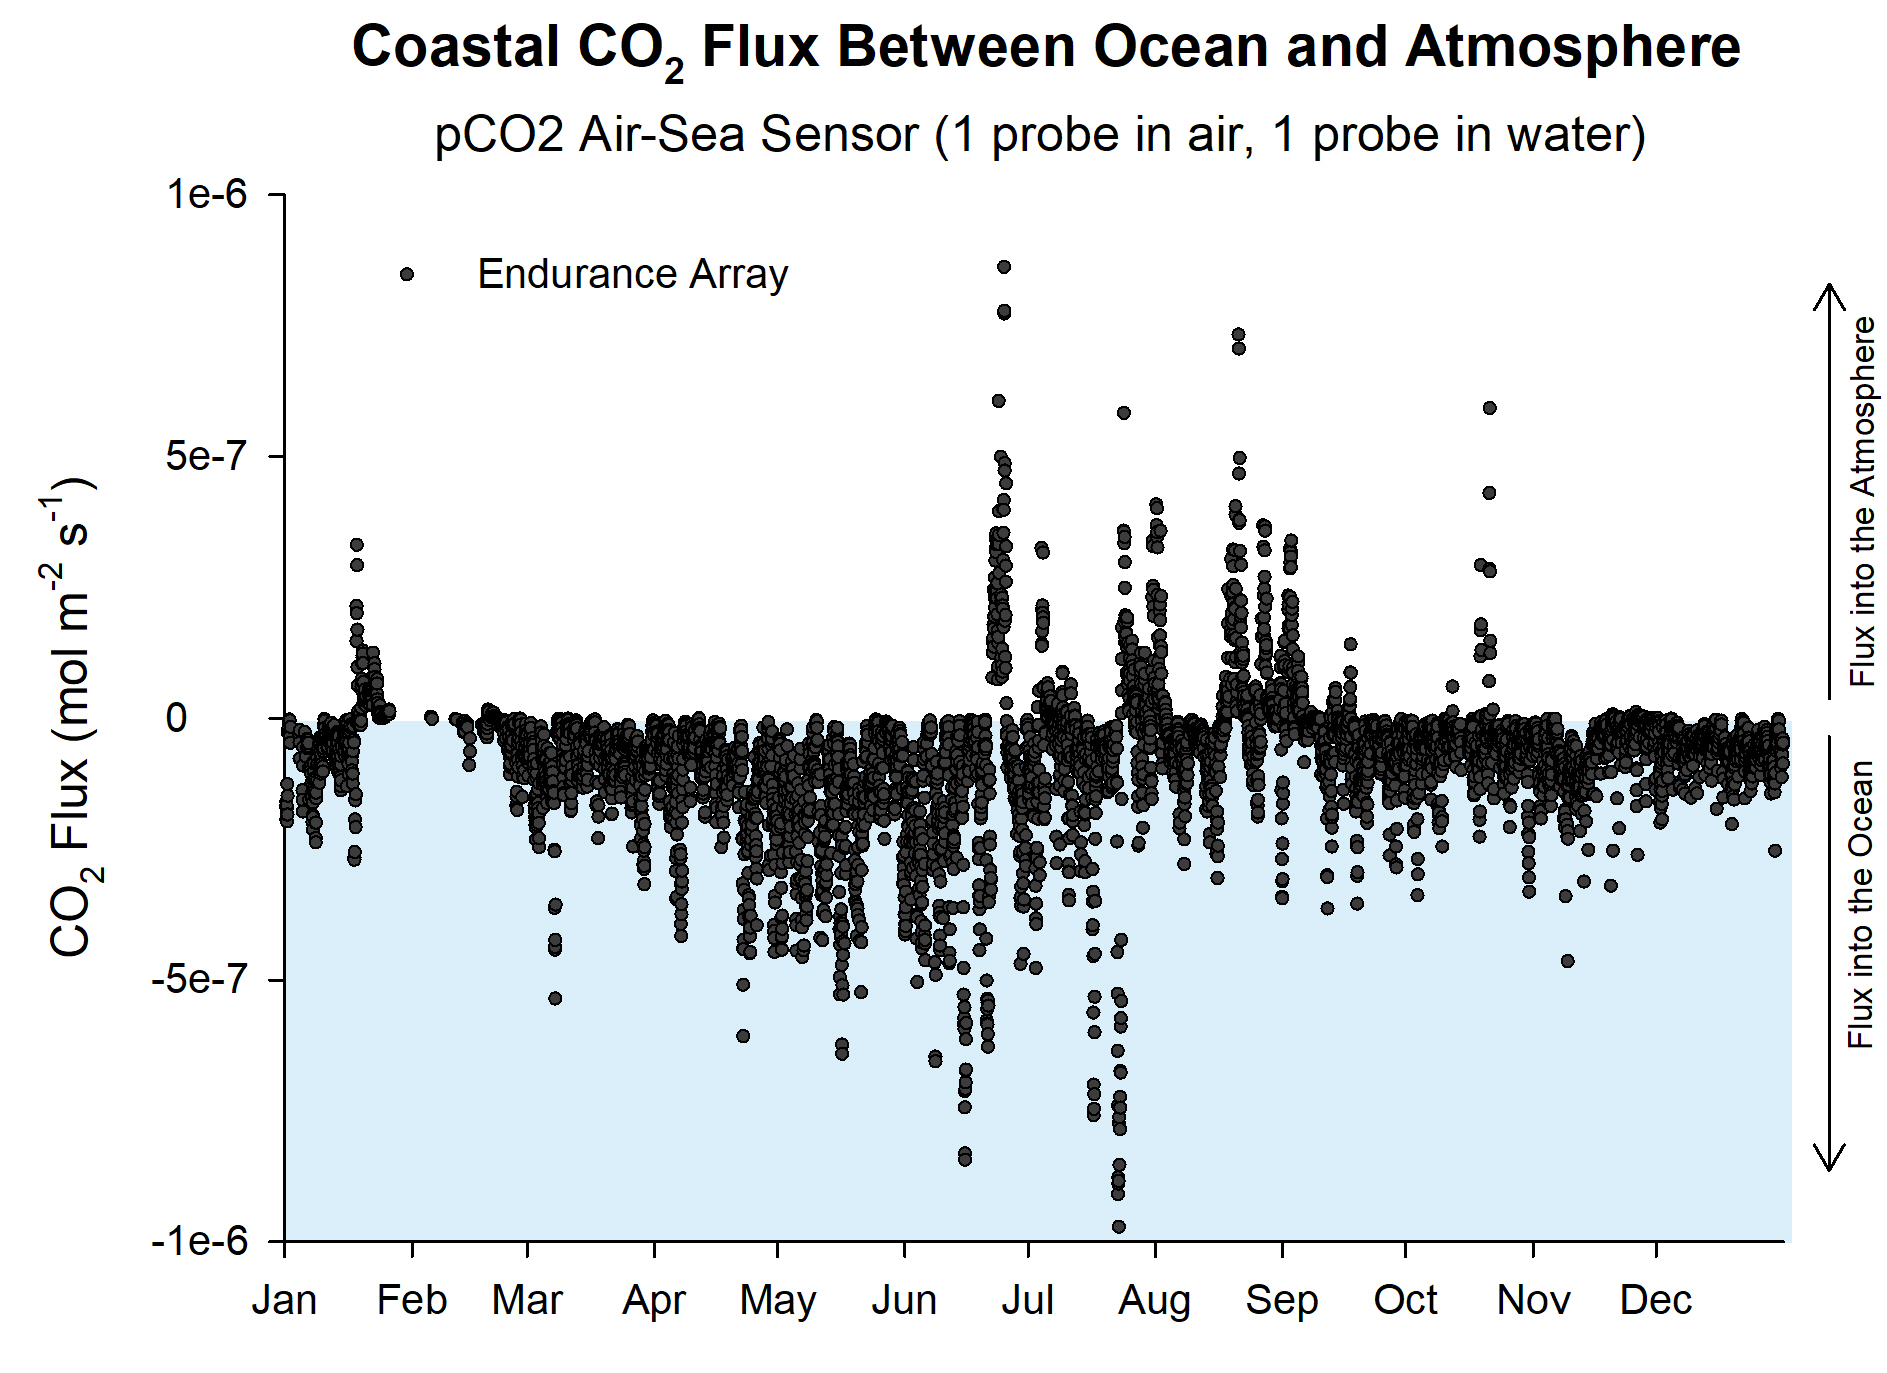
Figure 4. Graph of CO2 flux in and out of ocean from Coastal Endurance array.
As I mentioned earlier, chopping can be auto-generated, and while this feature is common across software and samplers, user-interface navigation and signposts are not. I recognize that any discussion of chopping using Logic Pro X’s Quick Sampler may be different inside another digital sampler, DAW, or even version of Logic Pro X. Opening up an audio file inside Logic’s Quick Sampler, there are four different modes, and chopping employs the “Slice” mode (Figure 3). The default Slice mode is Transients, which creates markers based upon the transients of the waveform. Since transients aren’t necessarily a feature of a data sonification, it’s best to alter the Slice mode setting. The three other Slice mode settings are Beat Divisions, Equal Divisions, and Manual. Beat Divisions may be applicable if the sonification is grid-based in time. Manual Mode allows one to set markers anywhere in the audio file based upon user discretion. Equal Divisions creates evenly-spaced markers. Like a graph, there are often equally spaced ticks along the x-axis. Thus, so long as the sonification only contains a data sonification sound mapped with equal divisions (like many of the Data Nuggets), chopping up the sonification with Equal Divisions is quick and logical. For the prototype, I selected Equal Divisions and set the divisions to twelve; the data sonification I used for prototyping (CO2 flux shown in Figure 4) mapped data across a single year and had twelve, equally-spaced sub-divisions — the twelve months in a single year.
With that, it’s performance-ready. With a USB piano keyboard plugged in, or even using Logic’s “Musical Typing” keyboard using QWERTY keys, one can physically play back the sonification from 12 different keys, which each key corresponding to an x-axis tick mark, or in my case, the month of the year. (Audio Example 1)
There are two additional settings to note here. First, the sampler should be placed into monophonic (one-voice) in order to not create any overlapping sounds actuated by multiple triggers that could confuse a listener. Second, the user may want to play only one ‘slice’ of audio per key or playback the rest of the file from the triggered position. While slice or full playback is a common sampler setting, Logic Pro X’s setting is labeled “Play to End” (Figure 3).
Lastly, unfortunately the audio file on the hard disk doesn’t get these markers. So if you close Logic, the audio file won’t contain these markers. This method only plays back the audio file from the sampler using a USB piano, QWERTY keyboard, or MIDI sequence. To embed the audio files on the hard disk with the same markers, one cannot use the Sampler inside Logic. Instead one must create track markers that can be exported to the audio file. This is a not-straight forward process and is mildly frustrating.
Audio Example 1. CO2 net flux data sonification with voice speaking tick marks (months of the year) in English throughout. The sonification depicts one year of data, so there are twelve audio chunks (January through December) that could be segmented for user interaction.
Audio Example 2. CO2 Flux Sampler Example. Keyboard-triggered playback with audio jumping around based upon human interaction with keybaord.
After running through this prototyping process, I do see the potential benefits of audio markers even if we there isn’t any implementation of an inclusively designed hardware or software solution. It still may be advantageous for us to include captioned audio markers within our sonification audio files that highlight aspects of the data, or embedding markers that indicate tick-marks in the audio file mapped to time (essentially the x- or y-axis from the graph). Common audio applications can read and display audio markers. Yet, can screen readers access audio markers? And easily? Or is this simply my visual bias wonting a curb cut? I need involvement and feedback from BVI practitioners on these basic questions.
References
Chopping "Sampling technique" Wikipedia. https://en.wikipedia.org/wiki/Chopping_(sampling_technique). Accessed July 5, 2022.
Polyend tracker. Polyend. https://polyend.com/tracker/
Zong, Jonathan, Crystal Lee, Alan Lundgard, JiWoong Jang, Daniel Hajas, and Arvind Satyanarayan. “Rich Screen Reader Experiences for Accessible Data Visualization.” Computer Graphics Forum, 2022. https://doi.org/10.48550/ARXIV.2205.04917.
Learn More
Learn more about data sonification.
Learn more about the parameters of sound.
Learn more about data mapping.
by Jon Bellona